Slay the Spire - Card Selection Study
An analysis of card reward choices in Slay the Spire, controlling for confounders like difficulty level to isolate their true effect on win rate, floors reached, and floors gained.
You could ask 100 different Slay the Spire players what their favorite card is and you'll get 100 different answers. You could ask those same players what their favorite deck is and you'll probably get a dozen different answers.
I want to know because I am not particularly the best at this game; not to say I don't know how to "play" the game, but I struggle with the nuances of knowing how to build a deck throughout a playthrough. I frankly don't know what cards are good and which ones stink, and as you progress through ascension level the margin of error gets tighter and every single card choice starts to matter more and more.
Given my background, I thought it would be easier and more fun to use aggregate player data and modeling to answer my question: what card choices will give me a better chance of progressing floors and winning?
What is Slay the Spire?
Slay the Spire is a roguelike deck-building game. Players attempt to ascend the spire (map) across several "Acts," fighting monsters in turn-based card battles.

Winning fights rewards a choice of new cards to add to your deck: 3 options of differing rarities are offered, drawn randomly from a card pool, and the player can pick one (or skip). These cards permanently shape the deck for the rest of the run. A run ends in either victory (clearing all Acts) or death; "Ascension levels" add optional difficulty modifiers that makeruns progressively harder.
The Data Behind it all
Thankfully, the developers behind Slay the Spire are very kind to offer up gameplay data for analysis. Jake Rabinowitz, the moderator mentioned in the patch notes and person who handles the game's internal metric tools, compiled data from 77 million player runs spanning multiple years and released the Google Drive for the files in a post, linked here. As extra layer of confirmation, I went back and read in their Version 2.2 "Happy Holidays" patch notes from November 30, 2020, where they said this:
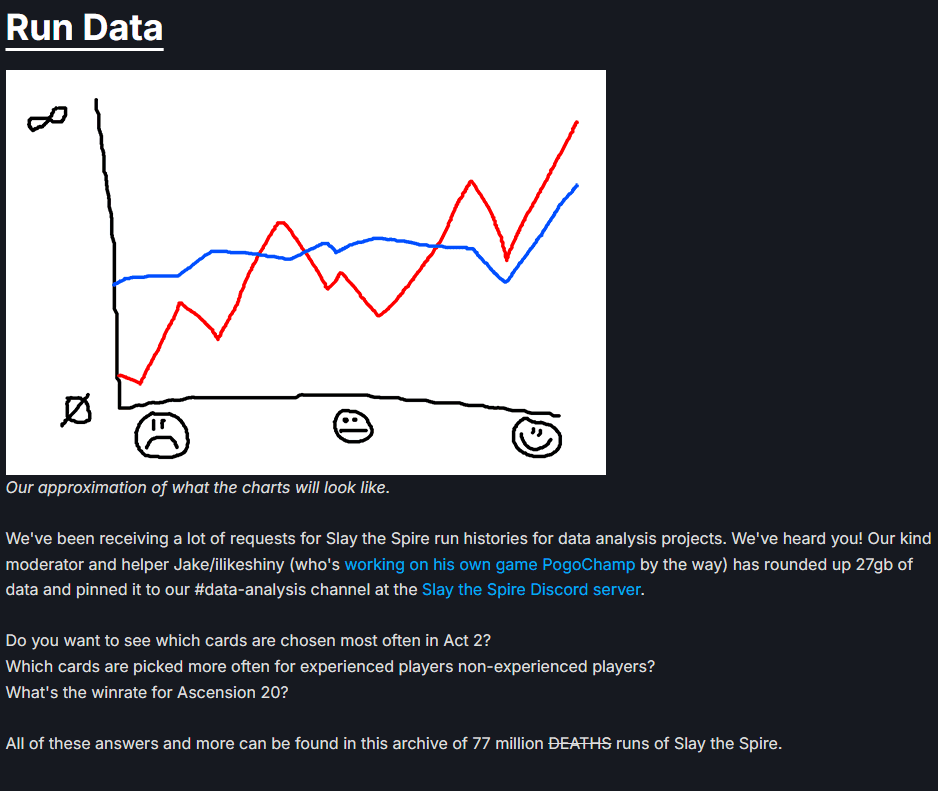
This confirms he's real, that's pretty awesome of them! Now there is no way my computer could handle ingesting all 77 million runs at 27GB of data AND run models on said data, so I shot for a goal of between 6 and 7 million runs. Should be enough data to produce reliable results from. The data was stored across ~52,500 JSON.gz files and contained all the information I needed to get going.
The Great Pipeline
I was initially doing this on a sample of 120,000 runs in 1 file using notebooks, but I realized during exploration I wanted something more challenging. I had been exploring Databricks alongside the project and thought to myself "I could use what I learned from Databricks to actually build something real, a data pipeline, and expand the data I was working on from 100,000 to millions". So after learning the Spark & Delta Lake concepts from Databricks, I applied them myself in a self-hosted local pipeline with Dagster orchestrating PySpark and Delta Lake.
It follows the traditional medallion architecture: bronze ingests the raw JSON.gz with little to no additional logic applied, silver applies the quality filters to remove bad or missing data and explodes out each run's nested card pick history into 1 row per pick, and gold produces the analysis ready summaries and tables. This includes the gold_card_choice_event table, which my downstream models run against.
The rebuild caught a bug that I had not noticed myself: the november sample I worked with in the notebooks contained duplicate run entries to those found in the ingested json.gz files. About 2% or 123,000 runs were counted twice. Another issue found in the silver pipeline is that there were no rows for cards passed over, which is bad when I want a counterfactual from which the model can learn the impact from a card NOT being selected. I had to fix both, which meant I had to re-materialize the entire pipeline from the beginning so the good data could pass on to the already created data tables.
Choosing the Right model
I had one specific goal for this project: a results-backed, per-card number for whether picking a card increased (or decreased) the odds of winning. After all, I'm trying to beat the game with math. I need to hold the rest of the game state constant, so additional confounding features will be added. Logistic Regression seemed to fit what I need given its relative simplicity and interpretability, and it gets me a coefficient that converts into an odds-winning ratio. The equations are shown below:
Logit Form:

Direct Win Probability Form (Sigmoid):

For the non-mathy folks reading, keep in mind the Beta values (1,2,...,5) are just the coefficients for each variable used, measuring the predicted "strength" the feature has over the model.
My first round, I was picking the cards I wanted to model based on surface level exploratory analysis. I used a screening notebook to shortlist 25-50 cards with the highest raw win rate lift. This was a trap, the winner's curse type, where the cards with higher raw win rate lift are the true effects plus sampling noise. Essentially, these cards could be winners by value added or just luck of the run they were apart of. To correct this, I stopped pre-selecting entirely and fit all 3,139 card + character pairs.
This is a note coming from the future, reflecting on why I chose Logistic Regression over other models.
I first thought of using a more predictive model — something like LightGBM, which would likely outperform logistic regression on raw predictive accuracy. I passed on that because accuracy was never the goal here; the whole point was a clean, per-card coefficient I could read easily with my human brain, and a gradient-boosted model that gives me a black box I'd need SHAP values for just to approximate what logistic regression gives me for free. It's a right solution, wrong problem scenario.
I also considered a hierarchical/pooled model; one joint fit that lets cards with very small sample size borrow statistical strength from the rest instead of each card fighting for its own independent estimate. It's technically the textbook-correct way to handle the small-sample cards that have difficulty converging later on. I ultimately passed on it for the simple reason: runtime. Independent per-card logistic regression already took 20-30 minutes to run start to finish every time I tuned something; a joint model estimating thousands of card effects together would likely have taken hours, for a benefit concentrated in a small, already-identifiable set of unstable cards. It just didn't feel like the benefits outweighed the costs here.
Where it Broke Down
Some of the resulting card fits were unstable; an example is the card "Barrage+1" (it's an upgraded card) with an odds ratio > 22 and a 95% confidence interval running from 1.2 to 417. In human terms, this means anywhere from "this could slightly improve your chances of winning, about 20%" to "you are deliberately trying to lose by not taking this card". With only a few hundred rows for this card to sample from and a lopsided win-loss split, the model hit quasi-separation: the optimizer saw this card as a near perfect fit for victory and kept pushing the coefficient towards infinity, so the fit never actually converged. Statsmodels doesn't check this outside of a warning, so my fix was to check for convergence and exclude anything that hadn't.
Multiple Comparisons
Fitting more than 2,200 cards and keeping everything under p < 0.05 comes with a cost: even if a fair number of cards have no real effect on the winning outcome, chance alone would still push several of the cards under the line. It's like flipping a coin 100 times and somewhere along the way there's 9 head flips in a row. This is expected from pure randomness and sheer number of coin flips, not evidence the coin is rigged one way or another. The fix I introduced was a Benjamini-Hochberg correction, which reduces the false positive rate. How it works: all 2,232 p-values are ranked from smallest to largest. For the card sitting at rank i out of m total tests, its own critical value is (i / m) * Q, where Q is the false discovery rate I set at 0.05, kept the same as p-value threshold. Scale down that ranked list and compare each p-value to its own critical value. Find the largest rank where the actual p-value is still smaller than its critical value; every card at or below that rank in the ranking is significant and everything past is dropped.
The Off-Class Problem
Even after all the issues I fixed and ran the models, another issue popped up in the results. The top card results for each character were...another character's card. This is technically possible due to a relic that enables card rewards to be from another class. So these card picks are real data, but they are confounded with a player using 1 specific relic. Instead of hand-typing the 300 card per class, aggregating each card offer by character gave me a distinct three-way split: character's own cards, colorless cards available to everyone, and other character's cards. The gap made the threshold creation fairly simple, and cards were excluded if below it.
Creating the Results dashboard
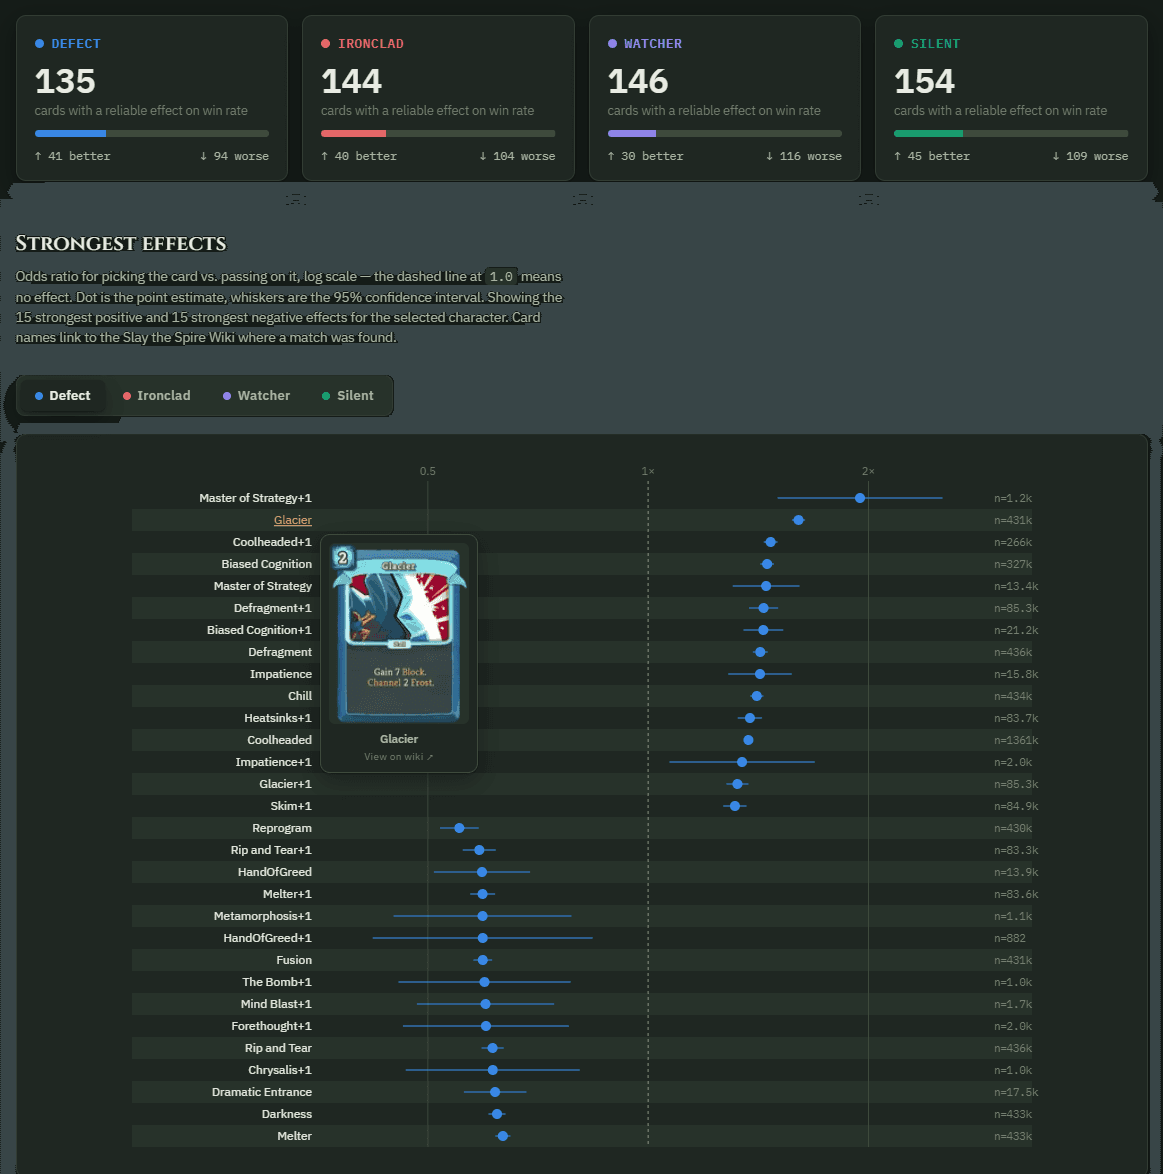
For this project, I went with a static page instead of a live table for simplicity; I did not plan to consistently run the pipeline to ingest new data or need a dashboard that has adjustable settings. But I still wanted some interactivity, notably the ability to see what each card does in-game while reading the results. Querying and resolving every name against the wiki's own search API at build time got 578 of 579 significant cards linked correctly. However, the card art preview had its own separate issue: the wiki's content delivery network (CDN) blocks hotlinked image requests based on the page's referring origin. So even though the same URL loaded fine on its own, many images failed to appear once the page went live on GitHub Pages. The fix was telling the browser not to send a referrer on those specific image requests.
Here's how it turned out:
My Findings
Take away the class-specific mechanics and the same pattern shows up four separate times in each character.
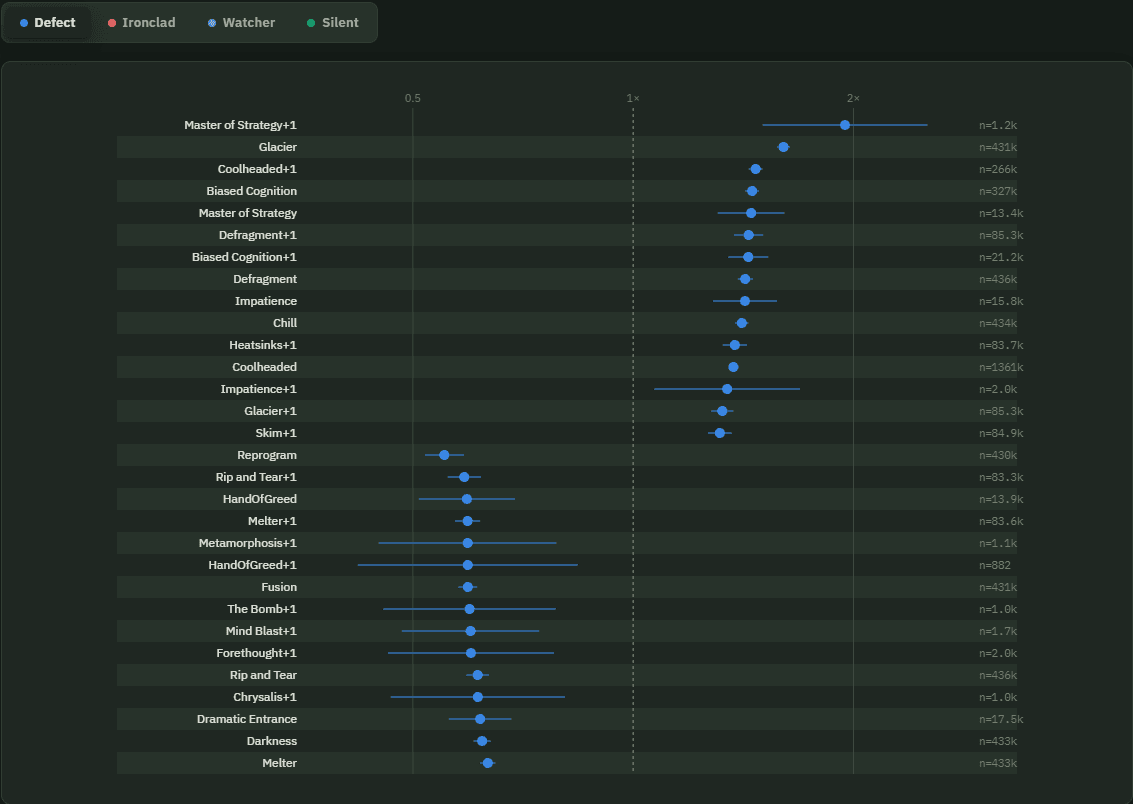
Defect's strongest picks are draw and block. Skim, Impatience, and Heatsinks are all card draw, and Glacier and Chill are stacking block and frost. Coolheaded is both, and Biased Cognition + Defragment increase focus, which increases the block from frost and damage from other orbs. On the other end, the cards Defect is worse off picking are almost entirely pure damage: Rip and Tear, Melter,The Bomb, Mind Blast.
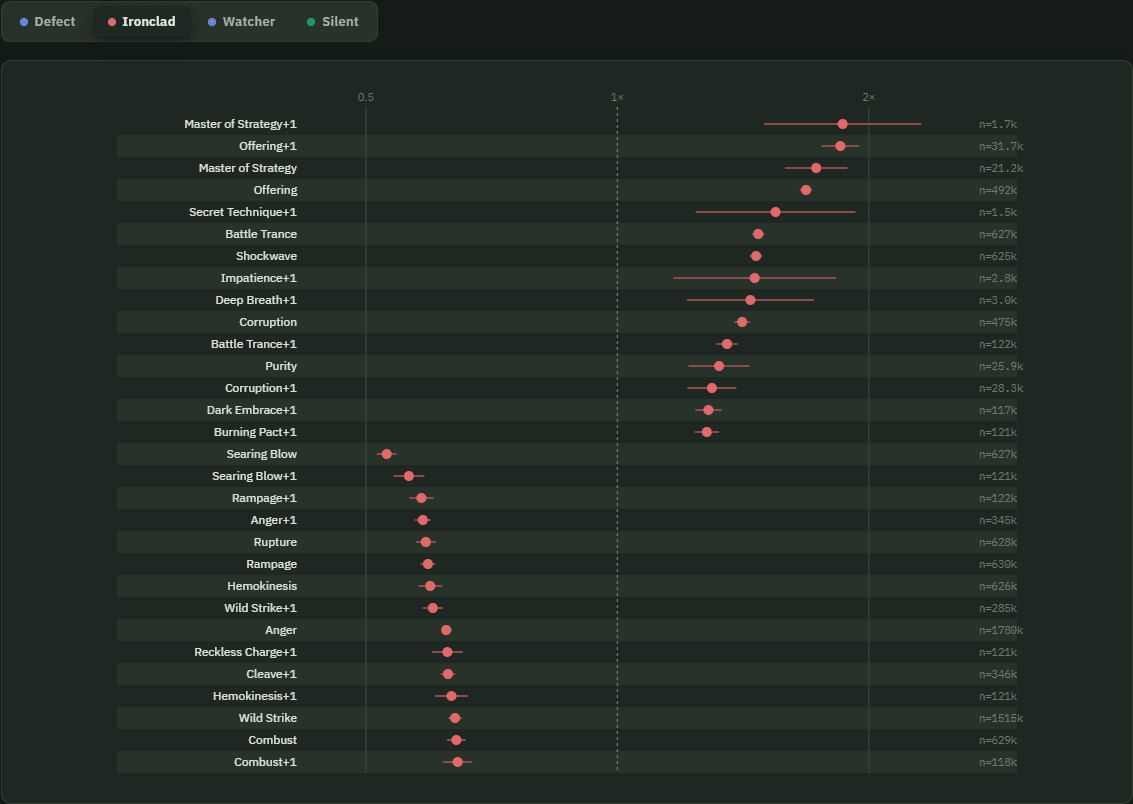
Ironclad results tells the same story. Its best cards lean on draw and energy generation: Offering, Battle Trance, Deep Breath, Secret Technique, Dark Embrace, Burning Pact. These are cards that buy more turns of options and more energy to use said options rather than outright damage. The cards not really helping Ironclad are, again, almost all pure damage: Searing Blow, Rampage, Anger, Hemokinesis, Wild Strike, Cleave, Combust.
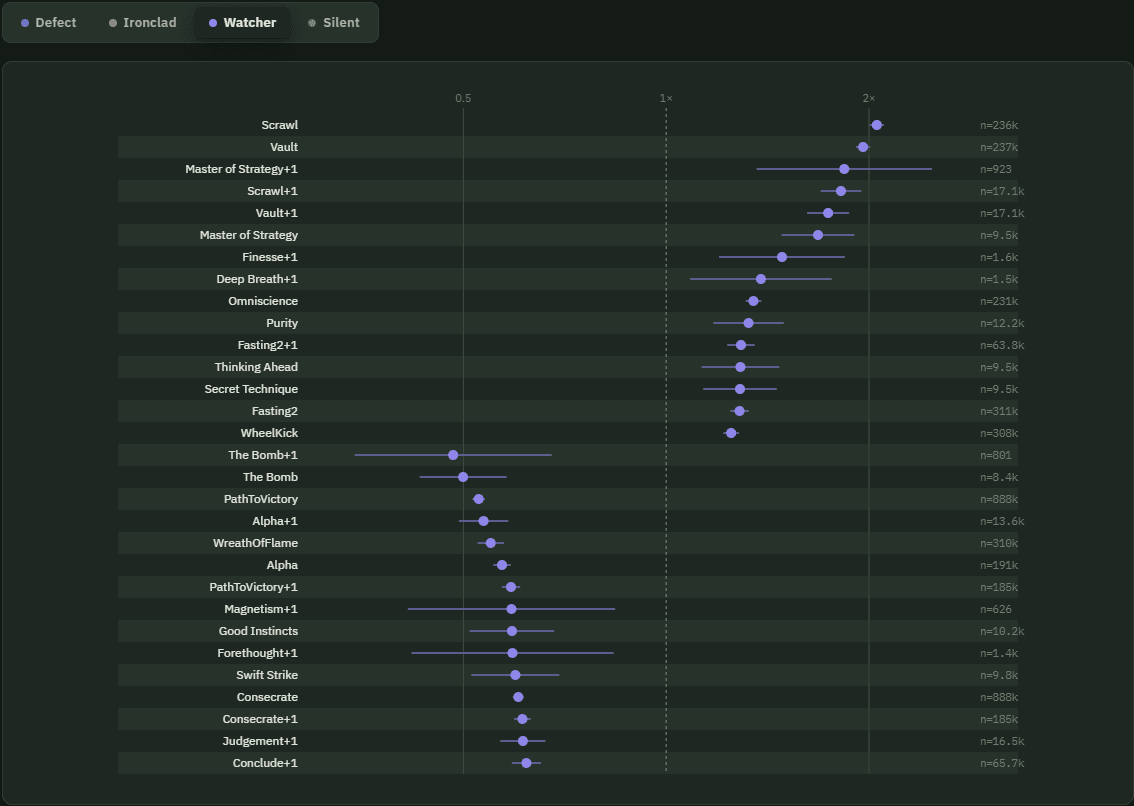
Watcher swaps "draw" for "extra turns" and the pattern still holds. Scrawl and Thinking Ahead give more draw, but Vault lets you take an additional turn outright sit right at the top too, close to 2x the odds of winning. The weakest cards are stance-damage payoffs like The Bomb, Path to Victory, Judgement, Conclude, and Consecrate.
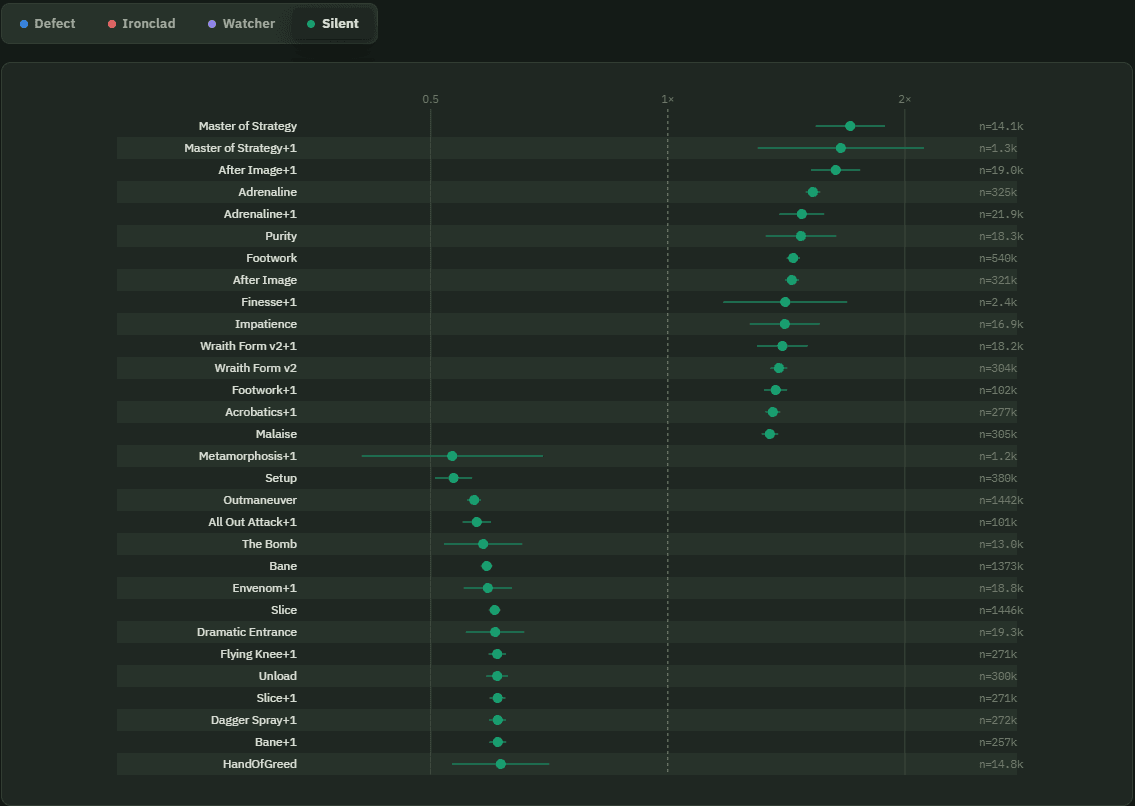
Silent's best card archetype are draw, block, and intangible (attacks only deal 1 damage). Adrenaline and Acrobatics for draw, Footwork and After Image for block, Wraith Form for intangibility, all near the top. Its weakest cards are mostly small, situational damage: Bane, Envenom, Slice, Unload, Dagger Spray.
One card shows up near the top for all four characters and I don't really think that's a coincidence: Master of Strategy. It's a colorless card that costs 0 energy, 1 time use, and draws 3 cards. It lands at or near the top of every single character's list. It kind of encapsulates what the results show: draw is valuable enough that a card doing nothing outside of it beats almost everything else in the game, no matter which class is holding it.
Conclusion
Back to my question at the start: what cards are best to pick if you want to win? Draw cards, you want cards that draw more cards. This was found to be consistent across all 4 characters alongside cards that provided block for defense.
Thinking about the mechanism and implications now, it's not really a shock this turned out to be the case. The game is a war, not a battle. What matters most is being able to conserve as much HP through fights as possible and to strike when it counts. A defensive deck with a couple good attack cards may take longer to beat down the monster, but it keeps you safer for the long run. An offensive deck with not many good defense cards shines quickly and burns out just as fast. Trading blows with early monsters leaves you too low health to handle later fights. Draw functions outside both deck types and enables you to get to your best cards quicker and more frequently.
I still lose a lot on this game, but keeping to the strategy of a lean deck, constant draw, good block, and a couple good damage cards has gotten me closer to winning more often. Don't just take my word for it, the proof is in the data.
Potential Next Steps
There's a couple next steps I think would be good: a model for floor progression and a more rigorous pooled model for the small-sample cards I couldn't properly estimate. Both are worth doing. But even without them, I got what I came for. An actual answer to my question of "getting good", backed by 7 million runs.